How does DNASTAR know whether Lasergene’s de novo and reference-guided (i.e., templated) assembly results are accurate?
De novo assembly quality is assessed by comparing (aligning) the de novo assembled contigs to the reference genome. This is accomplished using a genome-to-genome alignment algorithm like Mauve, which is available through our MegAlign Pro application (Figure 1).
Figure 1. A multiple alignment created using MegAlign Pro with the “Mauve” algorithm selected.
For reference-guided assemblies, we utilize “gold standard” data sets whenever possible to verify/validate our alignment and variant calling pipeline. An example of gold standard data is the human genomic data from the “Genome in a Bottle consortium” data.
Note that while our genomics software is usually run using a modern graphic user interface (GUI), we also support scripting. As we develop our software and add new features or algorithms, our quality control team uses scripting to align and analyze a wide range of data sets. We also provide Lasergene Genomics customers with the analysis tools to validate their own alignment and variant calling pipelines using VCF and BED files.
How does Lasergene software recognize poor-quality sequencing data and prevent it from negatively influencing the assembly?
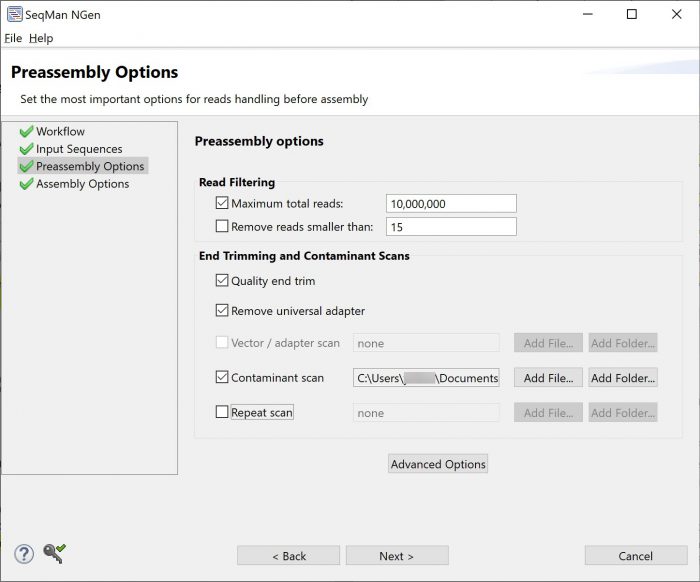
Our alignment algorithms have many different mechanisms to produce the best possible assemblies from both high-quality and less-than-ideal input sequence data. Some of these mechanisms include alignment stringency, vector trimming and contaminant screening settings that can be customized by the user during project setup.
Additionally, automatic scans and auto-trimming by our alignment algorithms make the best possible use of substandard data (Figure 2). This means that only the lowest quality sequence reads—those without any usable data—are removed from the alignment.
What methods are used for quantifying transcriptions and analyzing differential gene expression?
In an RNA-Seq alignment, the RPKM (reads per kilobase of transcript per million reads mapped) normalization method is used to quantify transcripts. If the RNA-Seq experiment has replicate sets and a control, differential gene expression can be calculated using either the DESEQ2 or EdgeR methods.
Lasergene Genomics software streamlines sequence assembly, gene expression quantification and differential gene expression analysis so users can go from raw sequence data to gene expression analysis quickly and efficiently.
Does Lasergene offer a genome browser, and what are these browsers used for? Do different types of analyses require different types of browsers?
Many researchers utilize genome browsers to compare different types of data tracks from one or multiple experiments. A wide range of visualization tools are available for both genomic and transcriptomic data sets.
Browsers handle common files such as sequence alignments (.bam files), variant tracks (.vcf), and coverage tracks (.wig). However, analysis tools that are specific to one data source are not necessarily compatible with all genome browsers. For example, transcriptomic analysis may include Sashimi plots/tracks for analysis of mRNA isoforms. Volcano plots, scatter plots, and heat maps are often used for differential gene expression analysis but may require additional software tools in addition to a browser.
Ideally, a researcher should have multiple data analysis tools available in a browser, as well as supporting data tables and graphs and charts that can be applied simultaneously and interactively to one or more data sets. DNASTAR’s GenVision Pro application is used for analysis of Sashimi plots (Figure 3). We are currently focusing our programming efforts to develop GenVision Pro into a fully featured genome browser and multiple-sample genomics analyzer.
Figure 3. The GenVision Pro genome browser displaying feature annotations and a Sashimi plot.
Do you want to know more about one of the topics above? Or do you have a question about something else? If so, please write to use at [email protected].


